Introduction to statistical computing using R
Last update: May 2022
Chapter 1 Introduction
R is a system for data manipulation, statistical computation and graphics liked for its flexibility in data manipulation, high-level graphics, and numerous specialized add-on packages that will handle almost all, if not all of your statistical needs.
It is based on an earlier public domain language called S that was developed in the 1970’s by a group of researchers at the Bell Laboratories, New Jersey, led by John Chambers. Both C programming and Unix operating system were developed in these same labs. Chambers in his book ``Software for Data Analysis" describes two motivating principles for the development of such a statistical system:
- Exploration - a system allowing researchers to ask meaningful questions about their data quickly and flexibly
- Trustworthiness - a system producing trustworthy results, and can be shown to be trustworthy by providing the codes used in the analysis to the scientific community for critique
R was developed as an implementation of the S language in the early 1990’s by Ross Ihaka and Robert Gentleman at the University of Auckland, New Zealand. Its name R is partly derived from the first developers first names, and also as a play on the name of its predecessor S.
The commercial implementation of the S language is available as S-PLUS. Like many other commercial softwares, S-PLUS is a closed system developed by a team of software engineers paid for their efforts. The software is sold to the users, and the underlying source code kept as a company secret. Users only use the features provided in the software and can only suggest new features but may not implement those features themselves. Many commercial softwares including Apple, Adobe, SAS, Stata, Microsoft etc. operate on this principle.
Linux operating system, Quantum GIS, Libreoffice/Openoffice and the Firefox web browser are examples of softwares similar to R which are built on open-source principles.
1.1 Why R?
Besides its excellent graphical and statistical capabilities, R is Open Source (all the ’’fancy" codes are open for study, change and to be freely distributed - Free to download) and has an enthusiastic online community that is likely to answer all your queries during your journey to conquering or mastering the R language. Alternative softwares may cost you hundreds to thousands of dollars for single licenses. R source code, developed by the core team, can be downloaded and examined by anyone, allowing for accelerated detection of software bugs and development of new features. It comes with built-in powerful analytical functions.
In the unlikely event that it does not have the method you are interested in using, chances are that someone else has written a function implementing the method - which may be available somewhere on the web - and can be downloaded, interrogated, used and improved for free. Once fully conversant with the R language, you will be able to write your own functions to meet your needs.
The debate on R versus SAS is huge, and the link here and here should form interesting reading.
In addition, there is an interesting blog page that examines the subject of The Popularity of Data Science Software - measuring the popularity/market share of several softwares used for advanced statistical analysis over the last few years.
1.2 What can R do?
- The R language can handle most, if not all of your data analysis requirements inclusive of linear, logistic, multilevel/hierarchical regressions, survival analysis, multivariate techniques (principal component analysis, multiple correspondence analysis, clustering techniques), genetic analysis, spatial analysis, among others. Many existing statistical methods are implemented in R and chances are that new methods will first /initially be implemented in R before in many other softwares.
1.3 Basics of R
- R is freely available for use and distribution under the license terms of GNU General Public License.
- R runs on Windows, Mac OS and Linux platforms.
- The latest version of R can be downloaded from the Comprehensive R Archive Network - (CRAN) : main website is http://cran.r-project.org.
- CRAN is a network of web servers mirrored all around the world (each contains identical up-to-date versions of code and R documentation). The idea is to use the CRAN mirror closest to you to minimize download time. With high-speed internet, you may never note any difference in download time.
- Once R is downloaded, install it to your computer just as you would any new software.
- The base R you have installed contains built-in functions (contained in libraries) that will comfortably handle certain data manipulations, analysis and graphing.
- Specialized groups of functions (packages) can be downloaded, added on to base R and used dependent on the needs of the researcher (very much like adding on apps into your smartphone)
- R is case-sensitive: Epidemiology in R will not be similar to epidemiology- but we will try this later with actual data
- The # character at the beginning of a line signifies a comment, and is therefore not executed. This is very helpful in describing codes and their functions
- Help files for R functions are obtained by preceding the function name with ? (e.g. ?mean)
1.4 R architecture
Source: 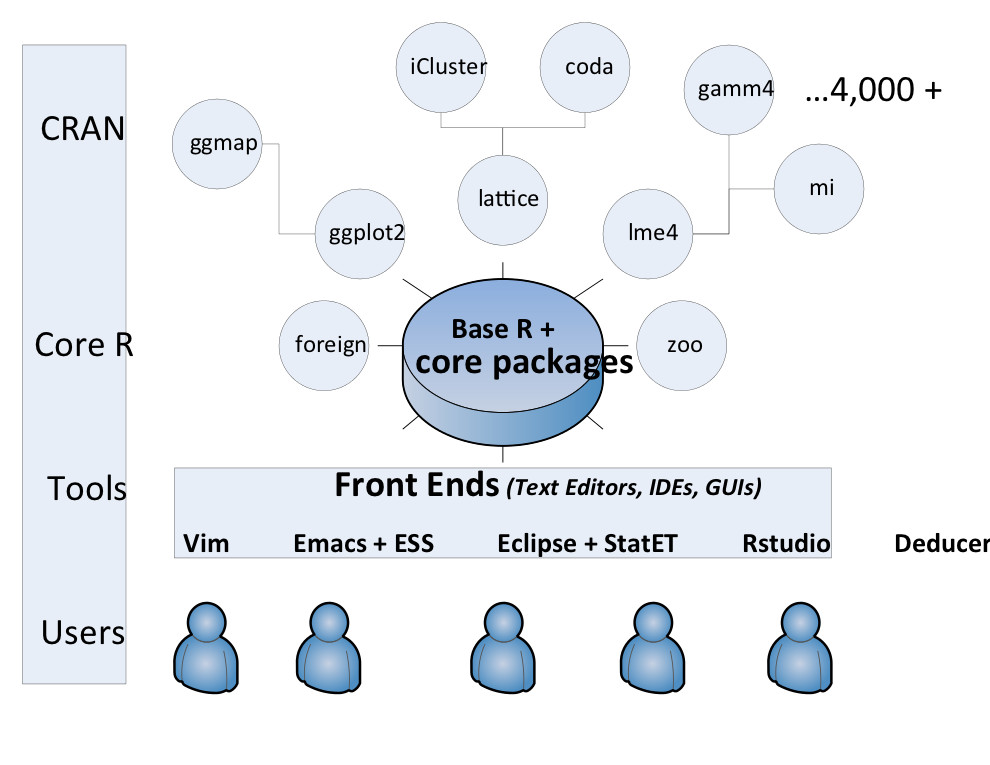
User downloads the Base R which comes pre-installed with core packages - providing functions for most basic data manipulations, importation, analysis and graphing.
A front-end software for example text editors as RStudio or Tinn-R is used to connect the user to R.
In-case the user has special requirements for extra functions not found in Base R and its core packages, the user may download and install specialised packages that contain the functions or methods required. There are 400+ packages available for use in CRAN.
A comprehensive list of contributed R packages, and a short description of each is found here.
1.5 Installing R
Go to the CRAN website http://cran.r-project.org and download the latest version of R.
Run the download to install Base R
We will use RStudio as the main front-end software for connecting us (the user) to R. Download RStudio from this site and install it.
Start the RStudio system which contains the console, a text editor, list of variables and functions loaded in the workspace and a file browser.
To understand more on the RStudio environment, watch the video below.
1.6 The R console
- Start the R system, a main window - R graphic-user-interface(RGui) and a sub-window (R Console) should appear. The console appears with a command prompt \(>\). Entering a command such as below: the result is printed immediately below your commands
2+5## [1] 7Notably R is not a menu-driven software with a graphical user interface (there have been attempts to create user interfaces), instead the researcher composes commands.
R is object-oriented: rather than work with files, we work with objects containing our data.
Take for example: our first command above (2+5) we can store it as an object assigned the name ``ob1" as below
Operators \(<-\) or \(=\) are used to assign things or store objects
These commands return nothing!
 ob1 <- 2+5
ob2 <- 2 * 6/3- To obtain contents of the two objects - you will need to call each of the objects created into the console as below
ob1## [1] 7 ob2## [1] 41.7 R workspaces
The objects you have created are contained within your current working environment R workspace.
This is internal to R and not a file stored on your computer.
To see a list of the objects within your R workspace, use
ls()## [1] "ob1" "ob2"- While you can use rm() to remove objects within your workspace.
## or to remove "ob1" from the workspace
rm(ob1)
To quit R, type q()
You will need to make a decision if you want to save your workspace or not. Clicking yes, your workspace is saved in a file with an extension .RData in your current working directory.
The next time you open R from the same working directory, the saved workspace will be restored.
It is good practice to always set your working directory - To do so, go to the menu and click Session \(>\) Set Working Directory \(>\) Choose directory. This will allow you to choose the folder you prefer to work from.
1.8 Useful tips for R
The UP key - accesses the command history within the R console. Particularly helpful when you are developing a code in R allowing you to run the line again and modify it if necessary. This saves you the need to re-type the code every time.
The “tab” key - serves as an autocomplete function. In R, its checks at the command line to determine whether the user is typing a known file name (scanning through to determine if there exists a file matching the file name the user is typing).
Use an R editor: Having a good R editor/IDES (integrated development environment) makes the learning and use of R easier, and the storing and retrieving to your R codes faster and efficient. There are several good R editors out there.
My preferred is RStudio - available to download from here. It is free, perhaps the easiest of the IDEs to work with for those with little programming experience, is open source and works well on any of the platforms (Windows, Mac, and Linux). ++ Once it launches it contains the console, a text editor, list of variables and functions loaded in the workspace, and a file browser
1.9 R resources and finding help
There are sufficient online resources to help with your R learning. Below is a list of some that you might find helpful:
Quick-R is an easy to read website containing many short topics and codes to get you started on data import, manipulation and statistics as implemented in . It is written in a simple language and provides appropriate examples in many instances.
UCLA R resources provides links to various R resources, a particular helpful one is Data Analysis Examples which has comprehensive codes required to carry out many statistical techniques in (and other softwares - Stata, SAS, Mplus and SPSS).
Stack Overflow: a beautiful resource with lots of questions and answers by and from professional and enthusiast programmers including the -user community.
R-bloggers amalgamates many blogs on .
Rseek]: an R project search engine.
Cookbook for R: an excellent resource for solutions to common tasks and problems in use of for data manipulation, analysis and graphing.
Cross Validated: question and answer site for people interested in statistics, machine learning, data analysis, data mining, and data visualization
R own resources - these are installed together with base R
help.search("sum")- “The paradigm in R is different. Rather than setting up a complete analysis at once, the process is highly interactive. You run a command (say fit a model), take the results and process it through another command (say a set of diagnostic plots), take those results and process it through another command (say cross-validation), etc. The cycle may include transforming the data, and looping back through the whole process again. You stop when you feel that you have fully analyzed the data. In that in the end, I believe that you will feel much more intimately in touch with your data and in control of your work. And it’s fun!”- Robert I. Kabacoff - creator of the Quick R website.